Prototyping
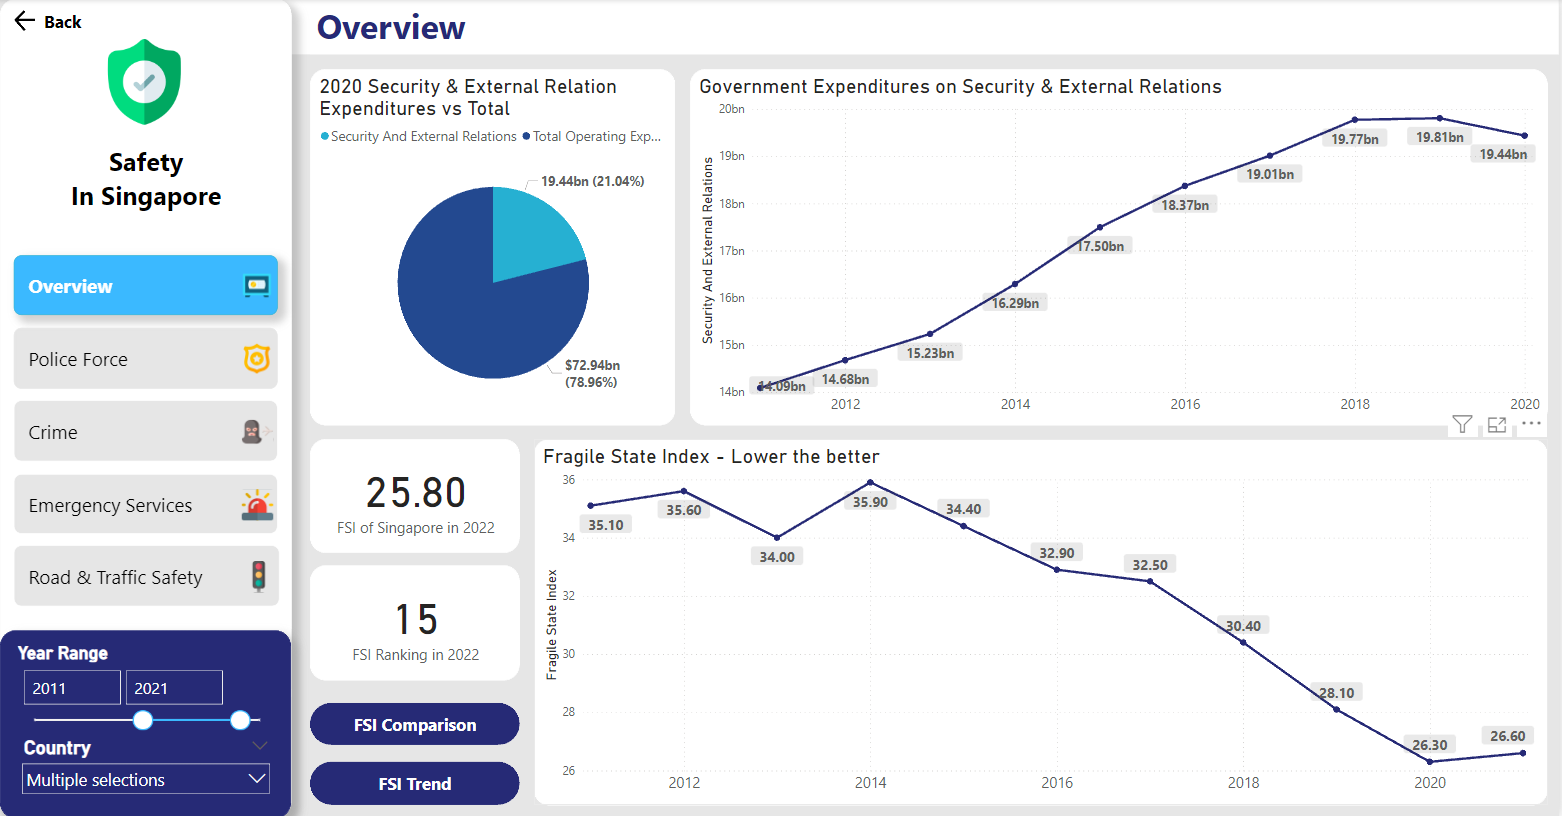
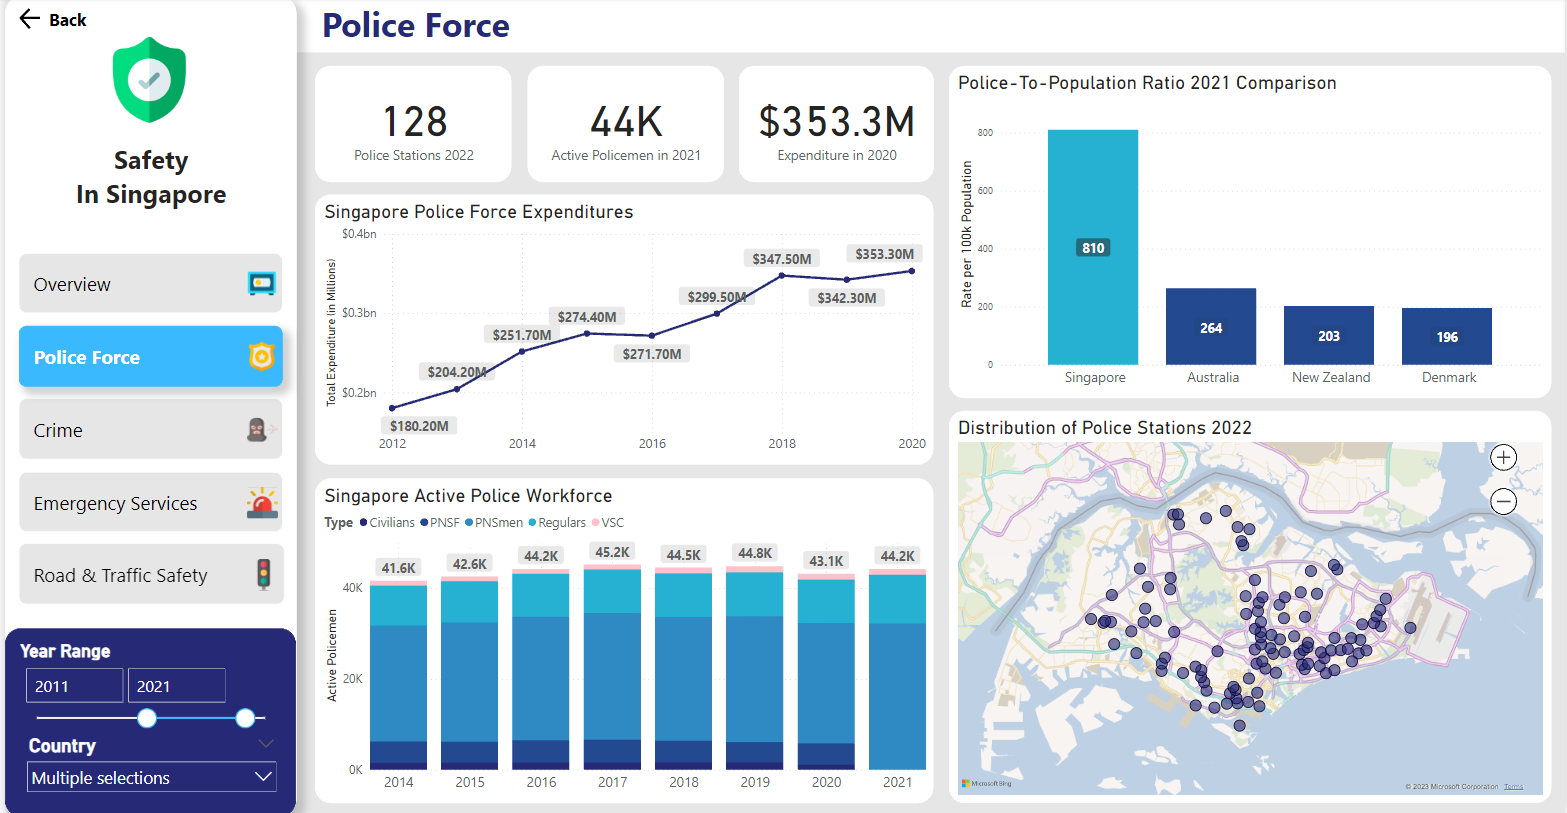
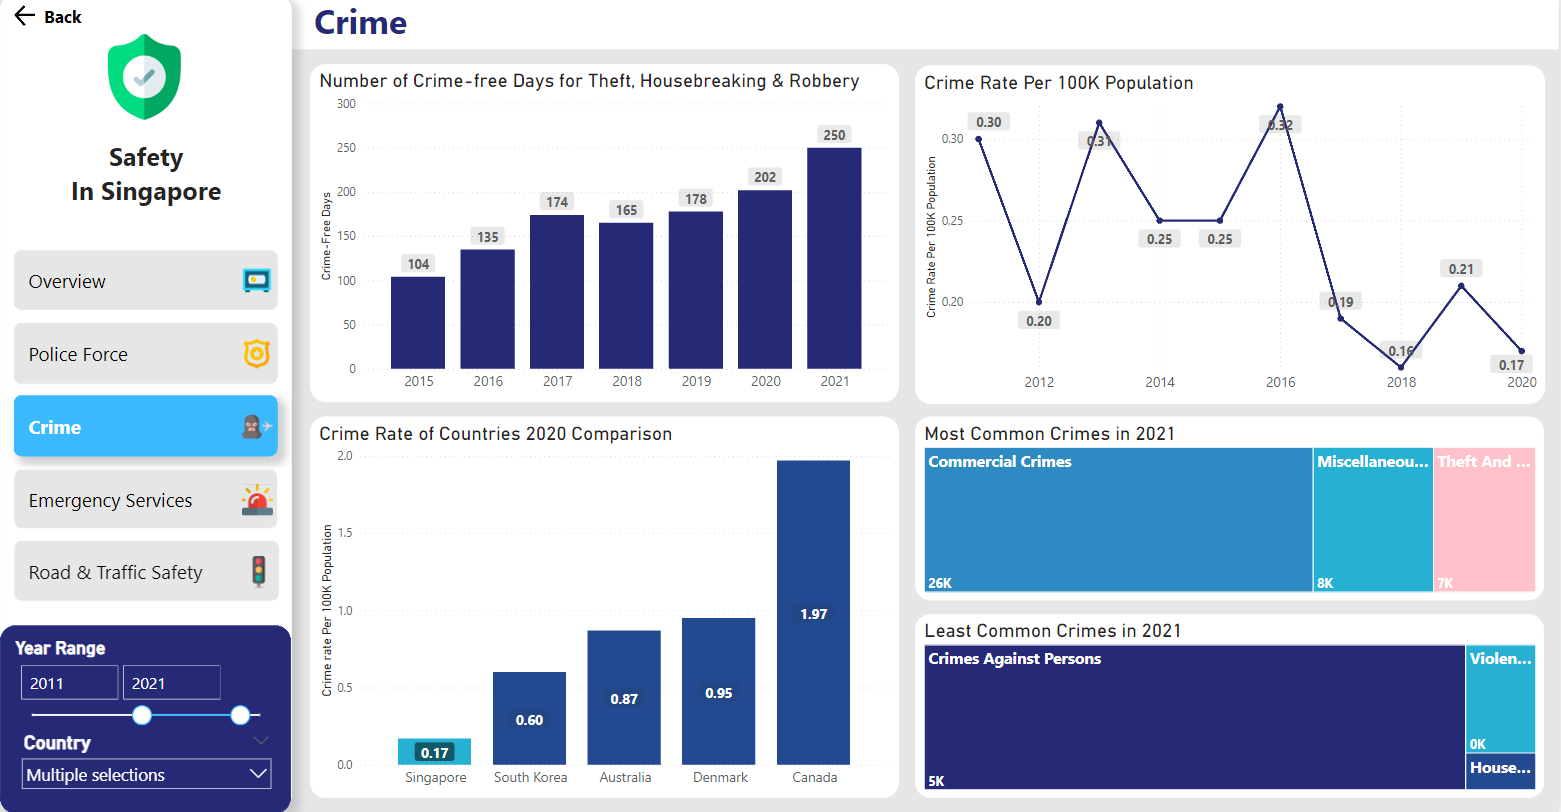
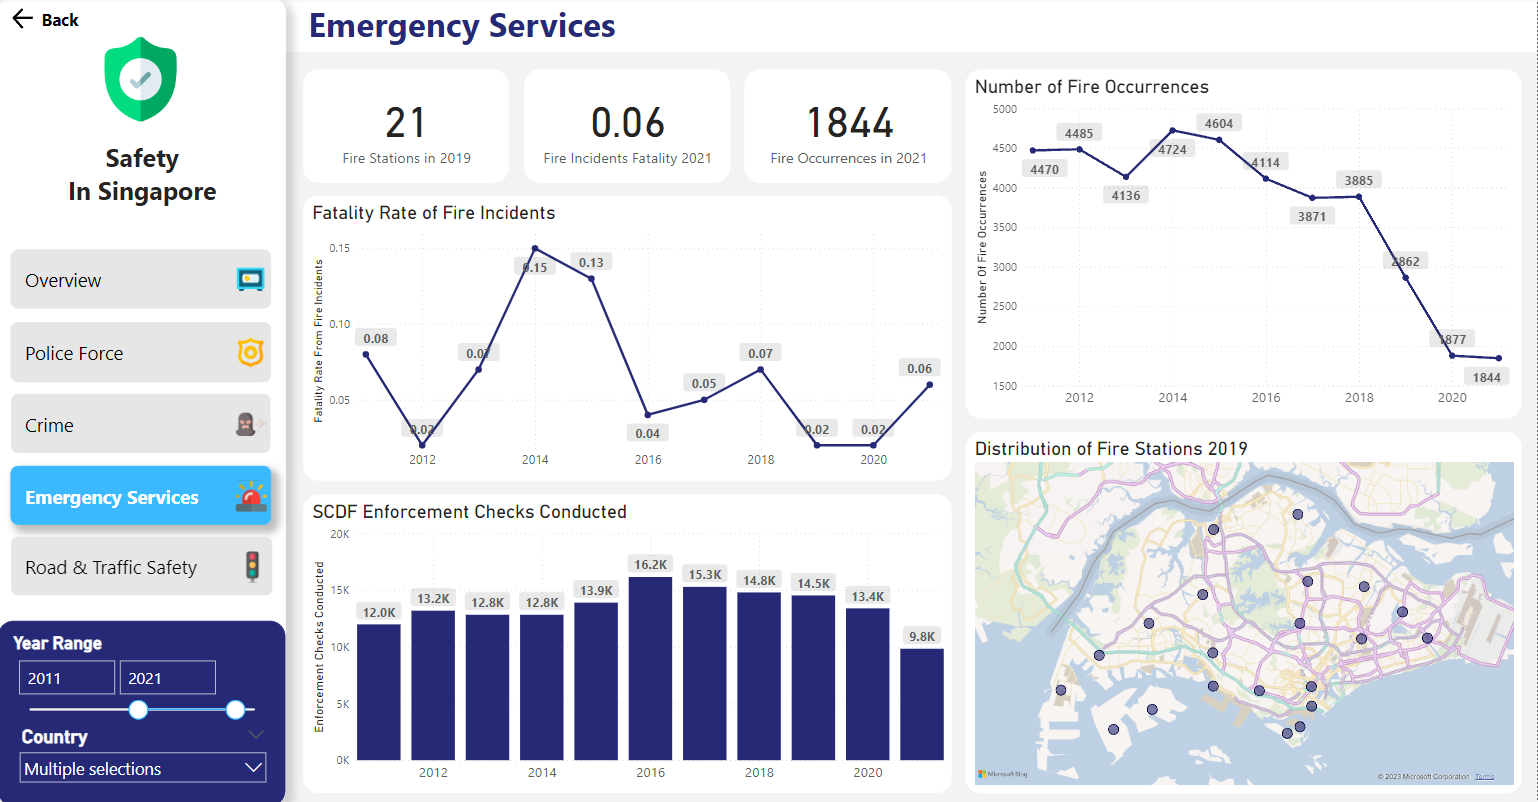
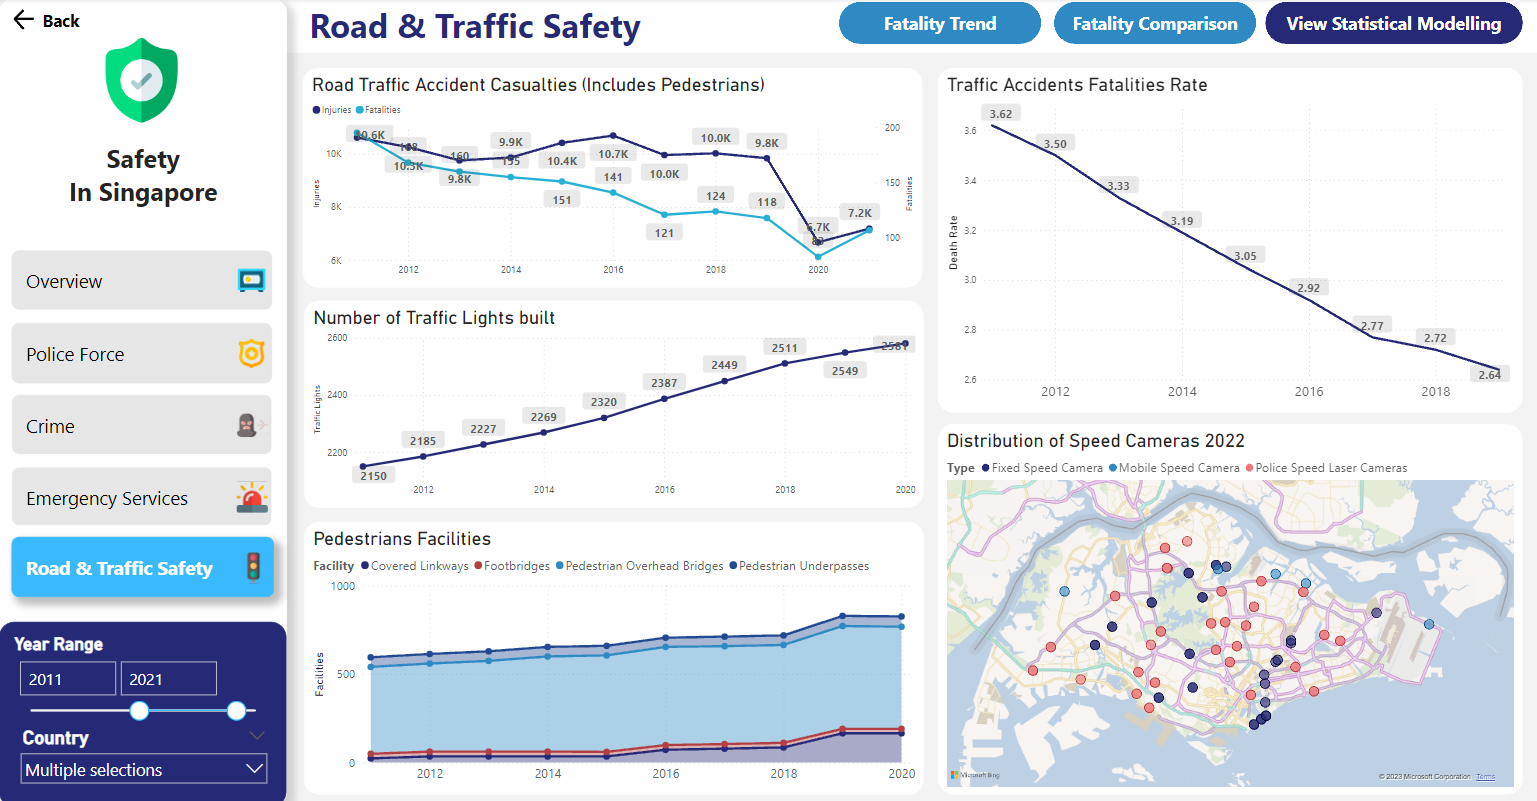
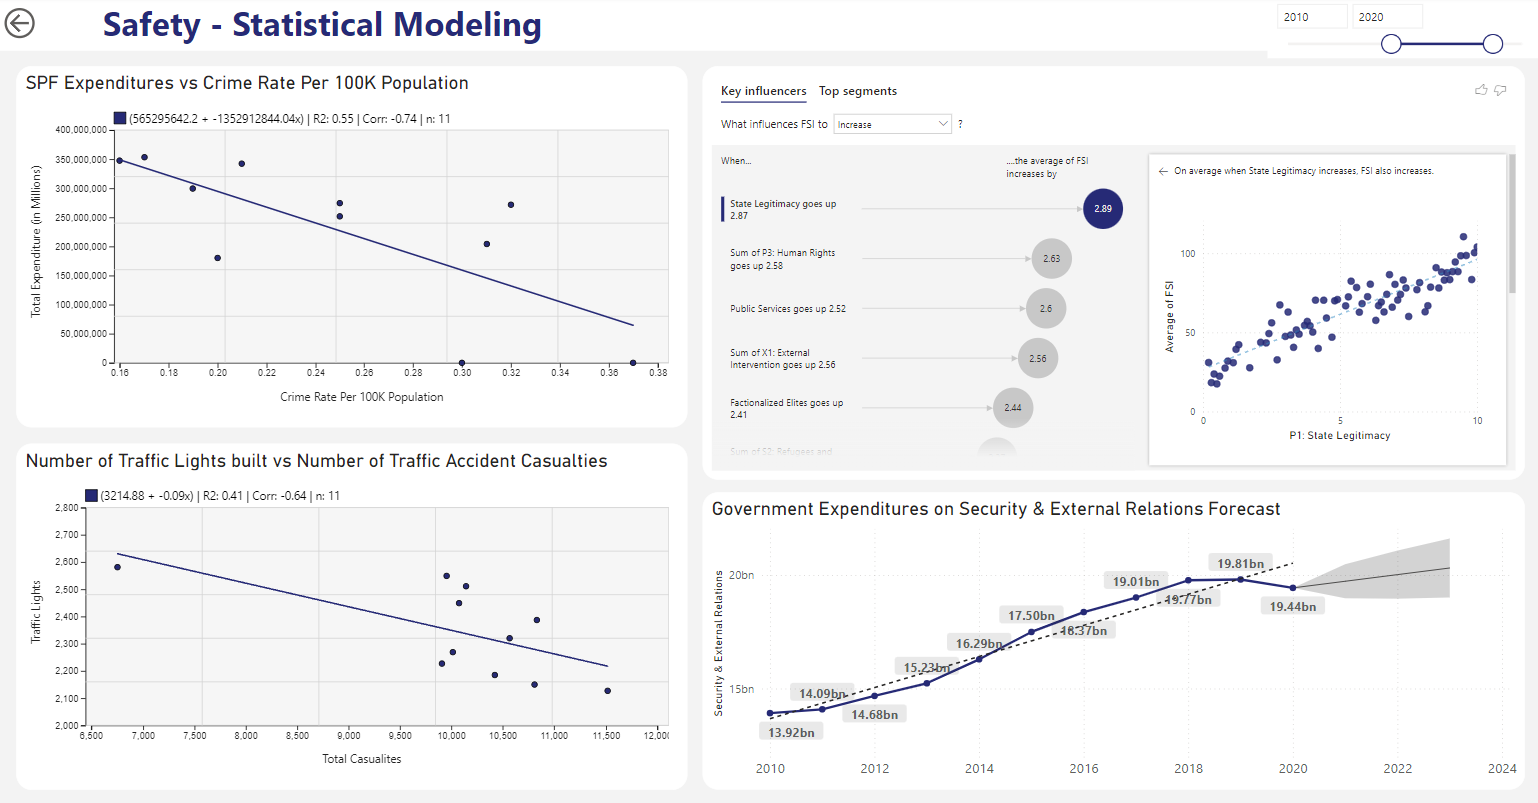
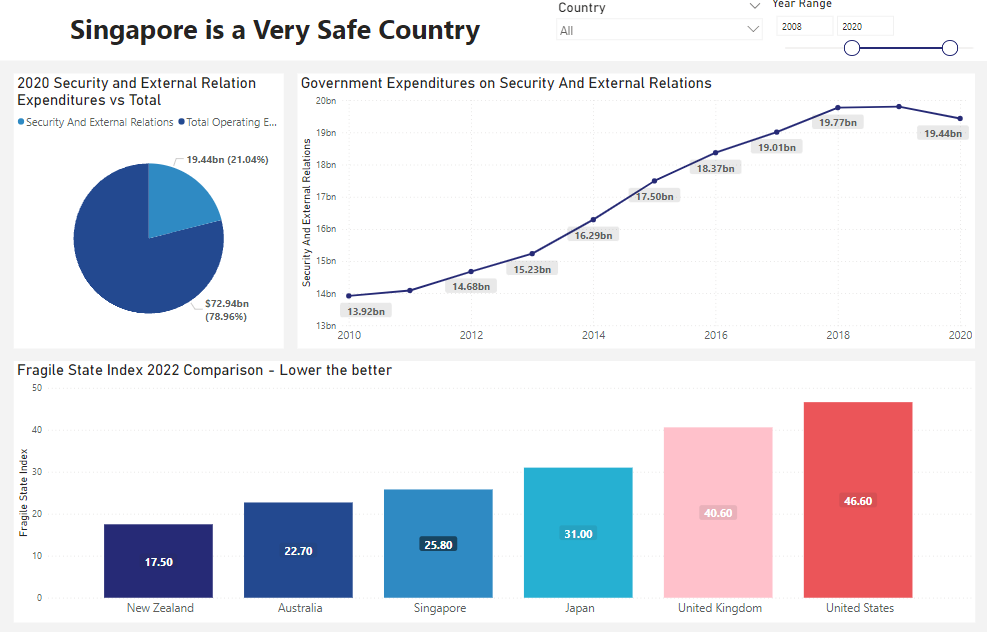
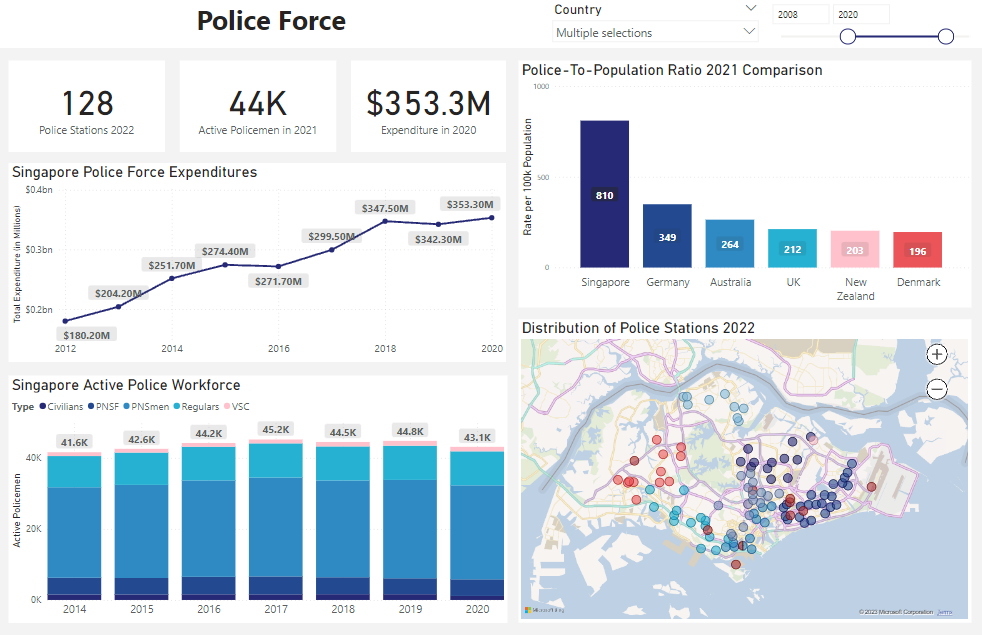
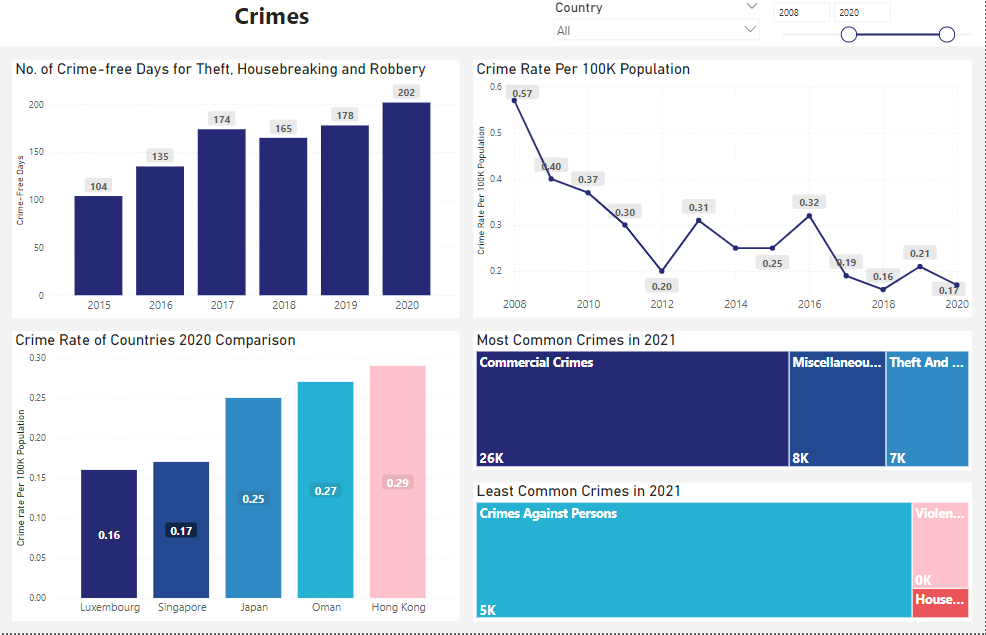
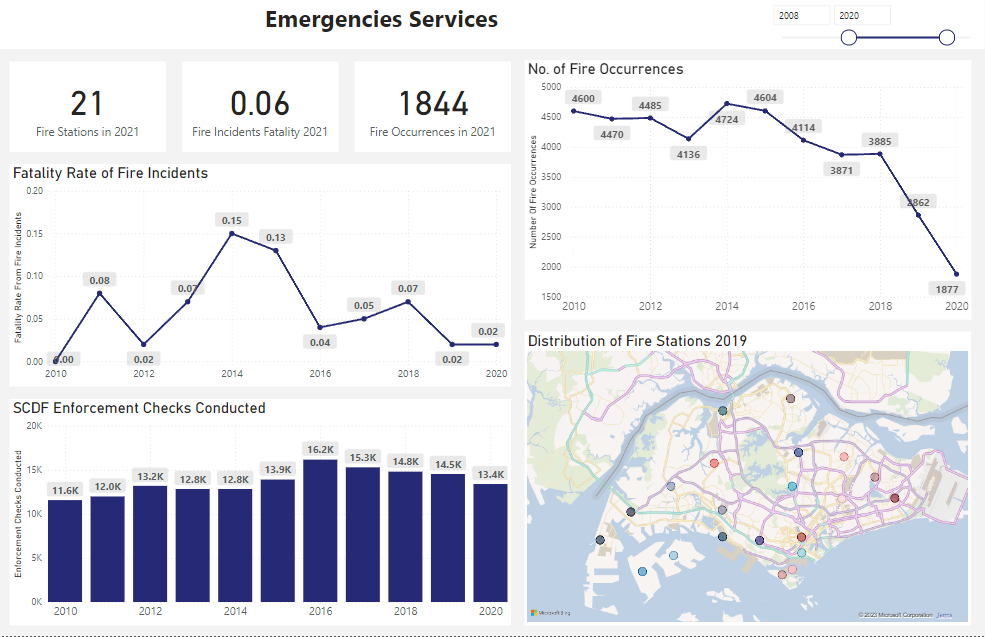
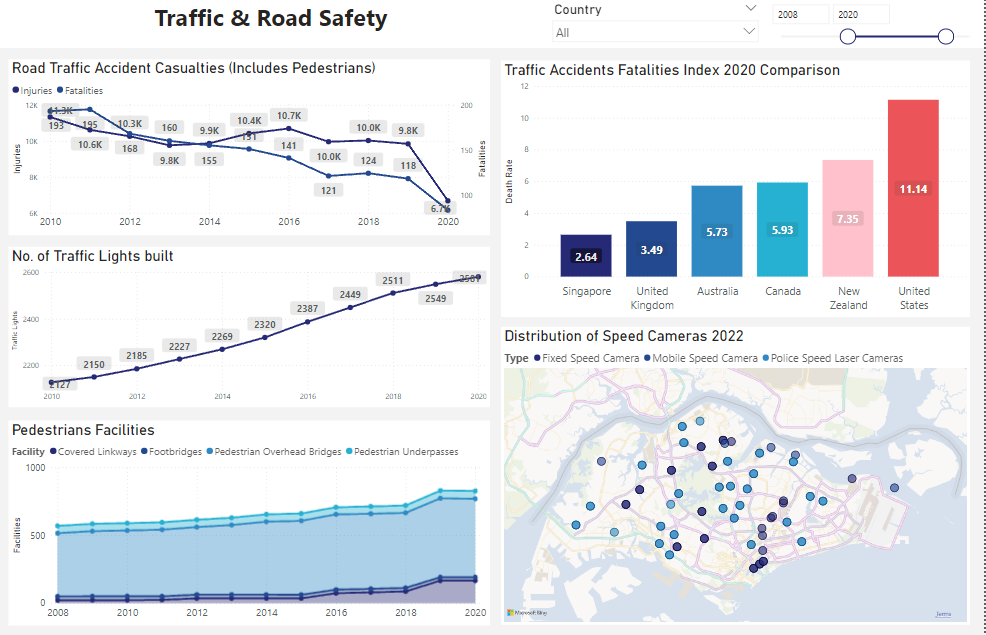
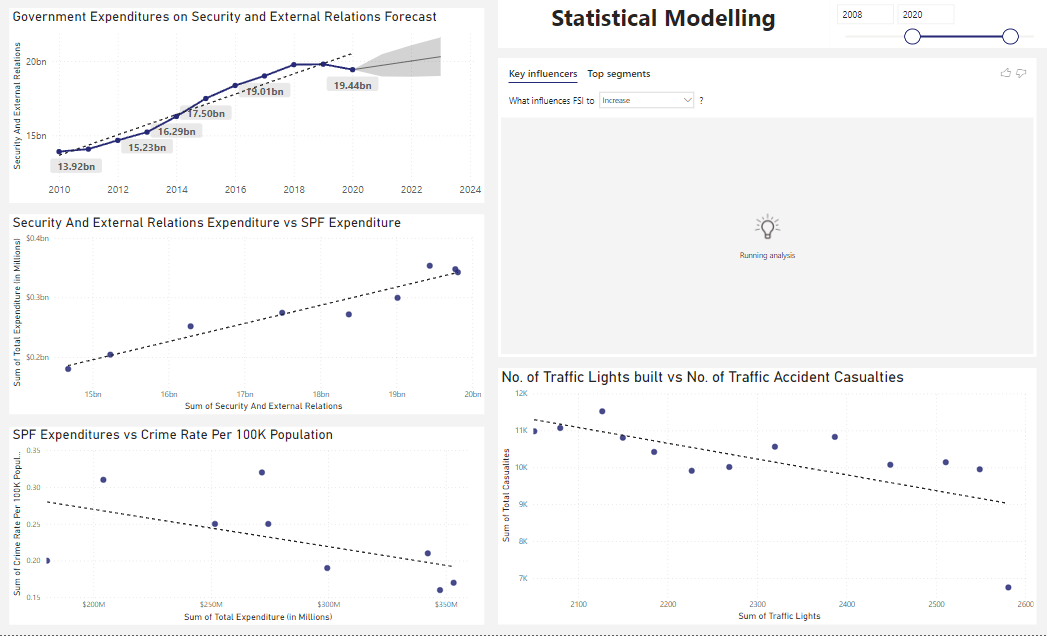
After the data was cleaned and transformed, we created prototypes using Power Bi to test our ideas and to get feedback from our users to ensure that it supports the hypothesis. The following shows the final iteration of the prototype:
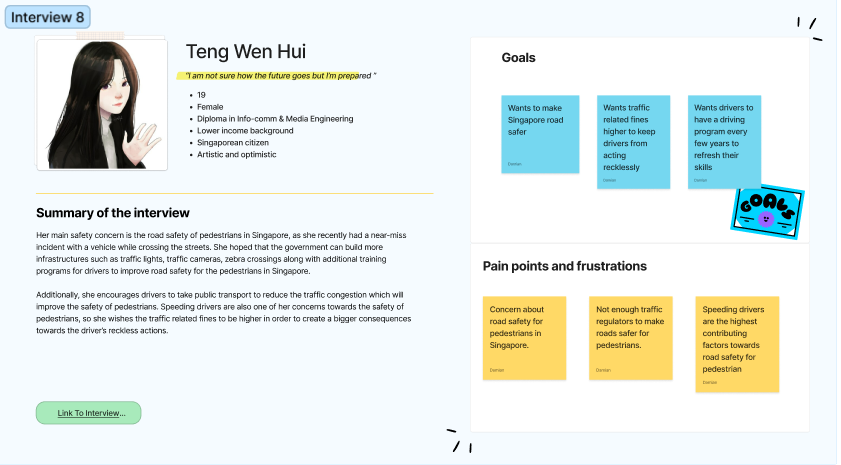
The prototype was tested with our target users and the feedback was incorporated into the final visual report. The prototype when throught a total of 5 iterations. Pictures below shows the prototype I created:
Integration
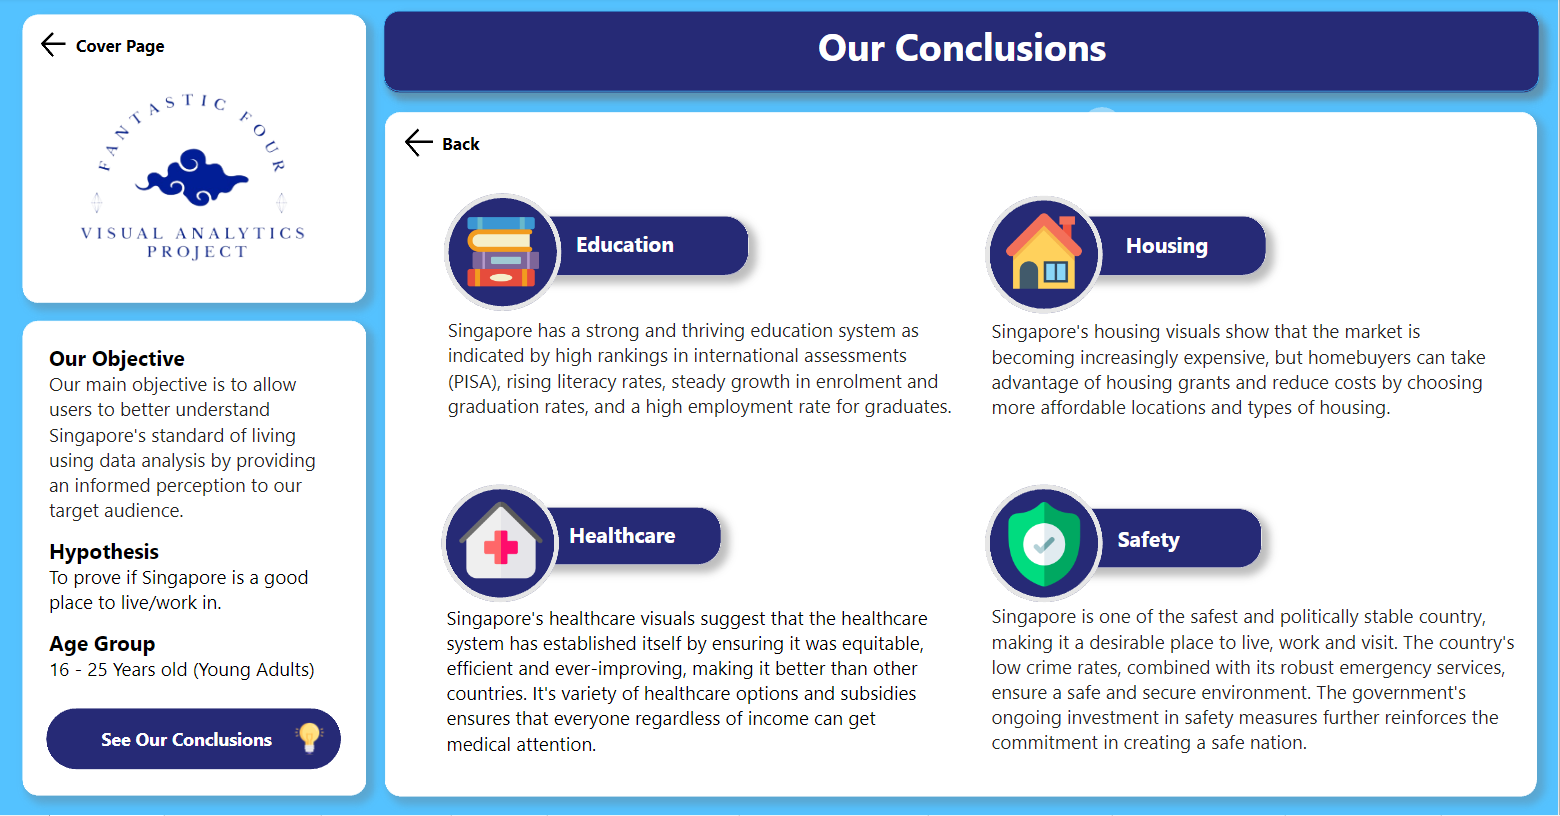
In order to integrate each of our team member's prototype, a master navigation system has to be created to allow users to navigate between each of the visual reports easily.
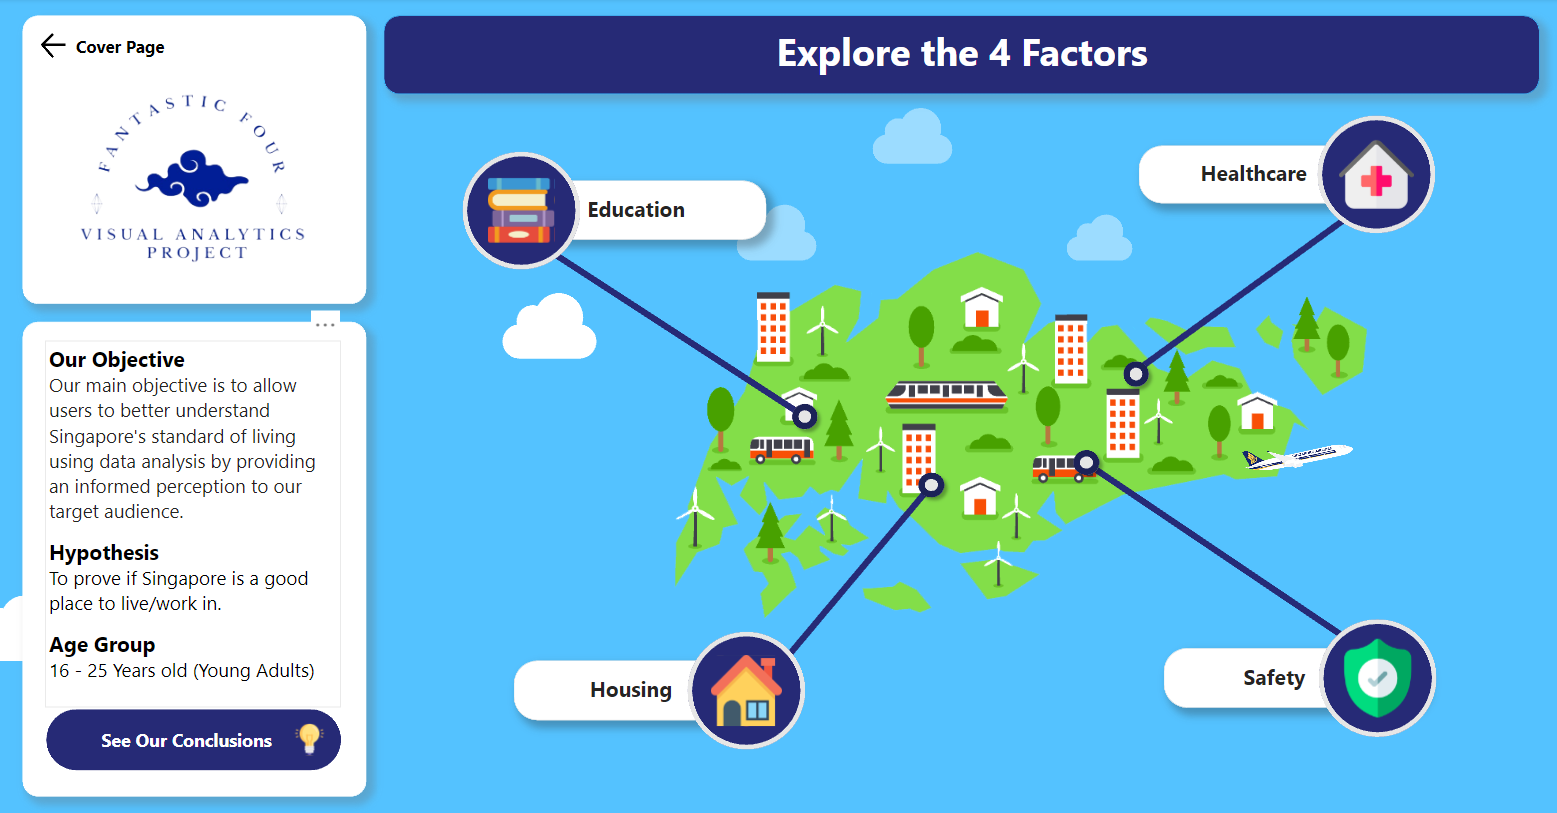
The image above shows the master navigation in a form of a map that allows users to click on individuals factors and view the respective report. The user interface is designed by me to be simple and intuitive to allow easy navigation throughout the visual report.